
Getting started with ICING
Icing is mainly an editor for the CellProperties file of a PSICS model. It also allows labels to be attached to morphologies for use with a particular channel distribution rule.
Opening a model
The model structure of PSICS is built around a folder containing the different components necessary for a particular set of models. There can be multiple versions of any particular component type (eg multiple different recording configurations) in the folder. The ones used in a particular run are selected with the master file for that run.
In line with this approach, PSICS opens all the files in a folder in one go. It is sufficient to pick any one of them, or the folder itself from the Open dialog. To get started quickly, there are also some built-in examples that can be opened with the Open built-in examples menu option.
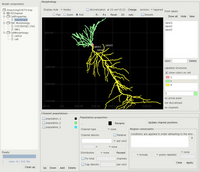
Main window with model components, the cell, and channel population definitions at the bottom.
The contents of the folder are displayed in the model browser on the left. All the components are shown although the only ones that are currently used by PSICS are the morphology files (either SWC morphologies or the PSICS native files marked as "CellMorphology"), and CellProperties files for the channel distributions. Selecting either of these file types makes it the focus of the editors in the middle and at the bottom.
There are two possible editing styles that can be selected with the Preferences menu. With auto-save on, the model in the file is always synchronized with the model being displayed by PSICS. There is no need ever to explicitly save it. With auto-save off, it acts more like a traditional application and you have to remember that the version you are editing is only in memory and the one on disk will not be changed unless you explicitly tell it to save it.
Morphology display and labelling
The morphology display serves several purposes. It can show the affect of a particular discretization parameter; it allows labels to be attached to the cell; and it displays channel positions. Whatever it is showing, the displayed object can be manipulated in three dimensions with the mouse.
Mouse controls
There are three modes for moving the cell which are selected with the Pan, Zoom and Roll buttons. To pan, you simply click any point on the display and drag. The zoom works by enlarging or shrinking the cell around the point you click as you move the mouse up or down. So if you click on a point in the structure, that point will remain visible, and in the same place, as everything else appears to get closer or further away.
The third option, Roll, is more complicated. With the left mouse button it rolls the structure around a selected point (or a point of its own choosing if you haven't selected one). To select a point, simply move the mouse over the cell until one of its points is highlighted as a small box, then click. This will remain the center of rotation until you select another point. The roll action behaves as if you were pushing the front of a ball that is centered on that point but that is free to move around it in any way. This operation makes it difficult sometimes to turn the cell around an axis coming out of the screen (you have to do it in two operations) so an alternative is provided for this with the R+ and R- buttons that just turn it 10 degrees clockwise or anticlockwise.
The roll action also combines the other two operations. In roll mode, if you click without dragging with the left mouse button it performs a zoom in by a fixed factor. Clicking with the right button zooms out again. Clicking and dragging with the right button has the same effect as the left button in pan mode. The result is that once you are familiar with the controls, everything necessary can be done from roll model.
Display options
The buttons and drop-down menus around the cell display provide a range of mostly self-explanatory options for what is displayed and how it is shown. Two of them, however, risk possible confusion with settings in a main model file: the discretization parameter and the sections drop-down.
Currently, ICING only edits morphologies and channel properties files. It does not do anything with any main run files that may be present in the folder. But it is still useful to visualize some effects of settings that are contained in these files. In particular, it provides the discretization and sections options purely for display purposes. Changing them does not change values in any of the run control files.
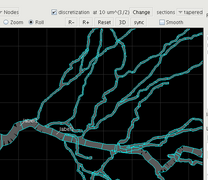
Element boundaries after discretization.
The discretization display shows how the cell would be compartmentalized for a particular value of the discretization parameter. You can change this to see how many compartments (shown at the bottom right of the cell display) will result from a particular value on a particular morphology. It can also be useful to see how the compartmentalization will split up a given channel distribution before deciding what value to use in a calculation. Note that in PSICS channels are not applied to compartments. Channels are applied to the cell, and then the whole problem is discretized internally as one of the last steps before the main calculation.
The sections menu applies only to SWC morphologies and corresponds to the "sections" attribute in a MorphologySource block. This is there to overcome a shortcoming in the interpretation of SWC morphologies: when the points at the ends of a segment have different radii, should it taper smoothly between the ends, or should it be kept cylindrical with the radius given by the distal end? This has a slight effect on the total area of the cell and consequently on the number of channels. Again, it is provided here for visualization purposes prior to choosing the value to use in the MorphologySource specification.
Files read in MorphML or PSICS native CellMorphology format do not have this option since the unambiguously specify which is the right interpretation for each segment. For CellMorphology files, all sections are assumed to taper uniformly unless the more distal point is marked as "minor" in which case it is taken to emerge at uniform radius from the sphere around the more proximal point.
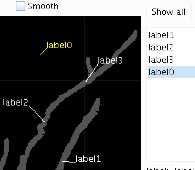
Labels attached to the cell can be used as boundaries for channel populations or to attach stimuli and recorders.
Labelling
Labelling is straightforward: clicking new adds an unattached label to the diagram. This can be dragged to attach it to the structure. It can be repositioned by dragging away until the connection detaches after which it can be re-attached somewhere else.
Channel populations and display
The lower panel is for editing populations present in a CellProperties file. The list on the left servers to select the population for editing, with the checkboxes to select whether it is shown on the cell. Depending on the size of the population it may take several seconds to recompute the positions for all the channels on a cell. In this case it can be easiest to modify the population with the display off, and then put it on to visualize the results.
All the functionality in the PSICS channel distribution model is accessible from the user interface, although some of it is presented in a slightly different way. In particular, ICING allows channel densities to be expressed relative to one another. In the stored CellProperties file, these are converted to standalone distribution rules that are referred to by each of the relative populations. The full details of channel distributions are covered in the next section. The the following paragraphs cover the most commonly used items.
To change the color of a population, select it in the list and then click the colored box under "Population properties".
The "Channel density" field can be either a number or an expression. As with many of the controls there is a "tooltip" if you hover the mouse over the label. In this case it indicates that there is more information if you click the label, including a description of the quantities that are available for use in expressions and some examples.
Because it can be slow, the display does not automatically update if you change the density. This only happens when you click Update channel density.
In conjunction with the density, one or more region constraints can be applied to cell to decide which parts of the cell the population should be applied to. These are boolean-valued conditions composed with the controls on the right. Most of the options relate to relative positions which respect to labels on the structure, but probably the most useful in general cases is the "where" operation that allows the expression to be entered by hand using the same quantities as for the density. For example, one of the screenshots uses "(p % 20) < 5" in this context to give clusters of channels every 20 microns.
These are the core functions for creating population definitions, visualizing them on cell morphologies and saving the results as CellProperties files ready for use in a calculation. Further information is provided in the tooltips while using Icing, the channel distribution summary and the CelProperties section of the file formats specification.